Soil is alive, and so is the story it tells. Beneath the surface, millions of microbes work together to recycle nutrients, build soil structure, and support healthy plant growth. Yet this activity is invisible to the eye.
Translating this invisible world into actionable insights requires not only advanced data analysis, but also clarity.
That’s exactly what the BIOTREX Report is designed to deliver.
Our goal is simple: to turn sophisticated microbial data into clear, meaningful information that everyone within agricultural sector – farmers, agronomists, researchers and product developers – can easily understand and use. The BIOTREX Report transforms behaviour of microbes into colourful visual scores that are easy to interpret. This helps to quickly assess the biological condition of your soil and detect shifts in microbial behaviour.
Let’s take a closer look at what’s inside.
What's inside the BIOTREX report
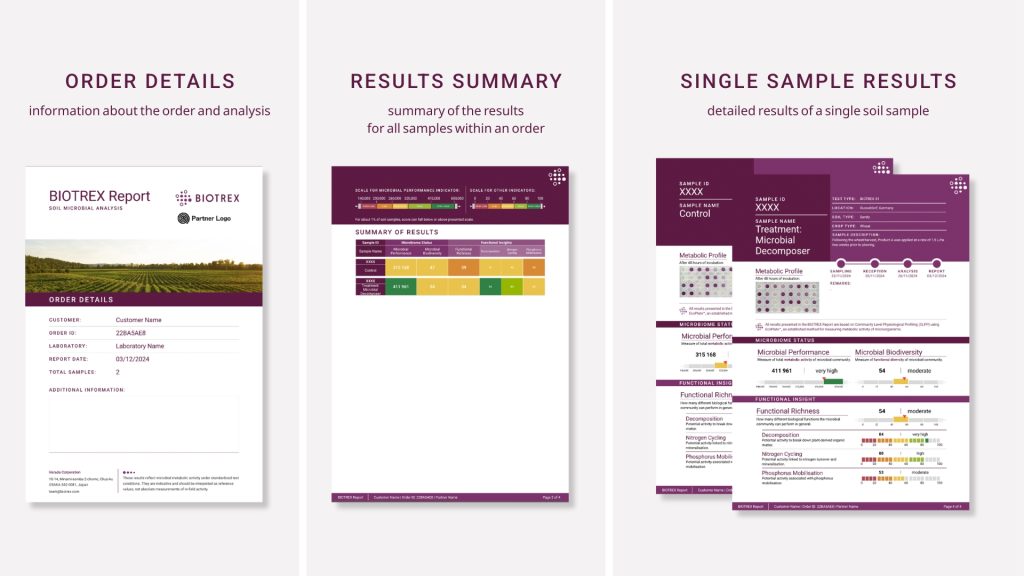
The BIOTREX Report is structured to guide you smoothly from overview to detail. Let’s see what each part of the report can provide.
- Order Details – provide key information about your order and analysis
- Results Summary – presents the results for all samples within an order in a colourful and visual way. This makes it easy to identify the results and compare the data across locations, treatments or time.
- Single Sample Results – provides detailed insights for a single soil sample. Each sample page provides a detailed report of your soil’s microbial condition and functionality.
Together, these parts create a complete, transparent, and visually intuitive picture of your soil analysis results.
How to read results from soil microbial analysis
The results presented in the BIOTREX Report are expressed as indices — numerical scores calculated from data gathered during the laboratory analysis of your soil sample. Each index condenses complex microbial activity patterns into a single, easy-to-read value that represents the biological state or functional potential of your soil.
Why biotrex indicators have no units
Indices are dimensionless values — they don’t measure a physical thing, and they don’t have physical units like “grams” or “meters.”
Instead, they represent a mathematical expression that combines ratios or proportions to describe a pattern or relationship. You can still compare those numbers (e.g. a field with Microbial Biodiversity score = 65 is more diverse than one with Microbial Biodiversity score = 17), but the number itself doesn’t have a unit — it’s dimensionless.
For more insight on how indices are calculated, see our detailed explanation on Why BIOTREX Indicators Have No Units.
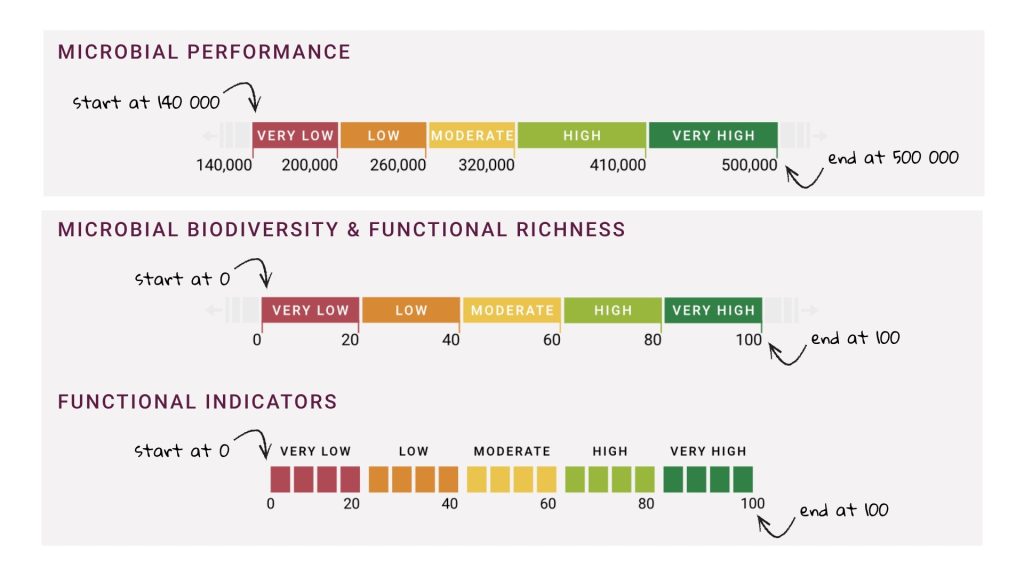
Understanding different scales
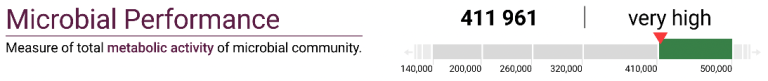
Among all BIOTREX indicators, Microbial Performance is a proprietary index developed exclusively by the inventors of the BIOTREX Analysis in Japan. It quantifies the overall activity and diversity level of the soil microbial community.
The other BIOTREX indicators (such as Microbial Biodiversity and Functional Richness) are based on indices commonly used in biological and ecological research. Because of these methodological differences, the score range and scale for Microbial Performance are unique and different than the other BIOTREX indicators.
About index ranges
By design, BIOTREX indicators do not have a fixed beginning or end — their possible range extends beyond the limits of the scale presented in the BIOTREX Report. In rare cases (less than 1% of soil samples), a result may fall slightly below or above the displayed range. This is completely normal and does not indicate any error in the analysis.
How the colour scale works
To make interpretation intuitive, BIOTREX indicators are presented on a colourful scale. The colour boundaries are based on the distribution of results gathered across many soil samples.
For European users, the scale is calibrated specifically to the distribution of European soils, ensuring that the interpretation reflects regional conditions and agricultural practices.
Using Microbial Performance as an example:
- Red and orange – very low and low microbial performance
- Yellow – moderate microbial performance
- Green and dark green – high and very high microbial performance
The same colour logic applies to all other BIOTREX indicators, allowing you to interpret results quickly and consistently across different soil functions.
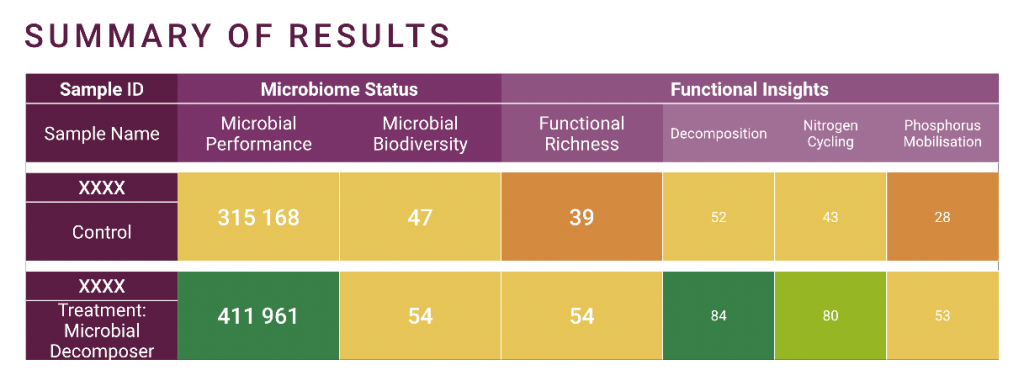
Summary page: Indicators Scale and Results Overview
The Summary Page gives you a bird’s-eye view of your soil’s biological condition. It presents results for each sample within the order. Each indicator is visualized on a colourful scale, making interpretation intuitive and fast. With just one glance, you can:
- Skim through all results and immediately spot strengths or weaknesses,
- Compare multiple samples side-by-side,
- See whether your soil biology is improving over time or responding to new practices and inputs.
detailed results for a single sample
After reviewing the summary, the Single Sample Results pages let you examine each soil sample in depth. They provide a full picture of the sample’s microbial performance and functional potential, together with key metadata (location, crop, and management details) and a transparent log of the analysis.
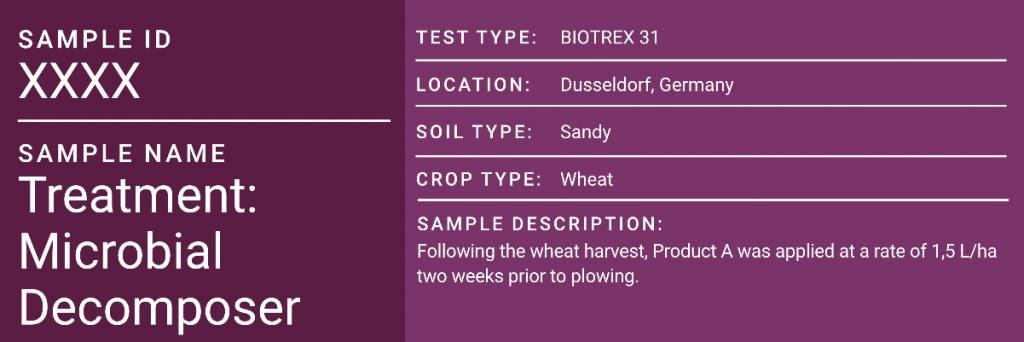
sample metadata
Here, you’ll find background information about the field and the sample itself — such as location, soil type and crop. This context is important, as it helps interpret biological differences between samples and link results to real on-farm conditions.
events timeline
Transparency matters. The Events Timeline lets you see every step of the analysis process — from the moment your soil sample was taken to when results were finalised. This ensures that each analysis was properly handled.

Metabolic profile: the microbial fingerprint
This is one of the most distinctive features of the BIOTREX Report.
The Metabolic Profile shows a real photo of the microplate used during the soil analysis — your soil’s unique microbial “fingerprint.”
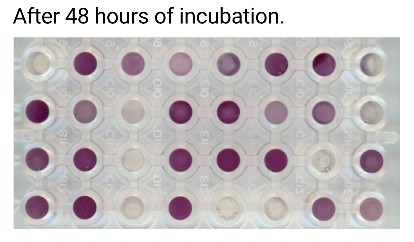
Each well on the plate contains a different carbon substrate. When microbes use a substrate, the well changes colour. The resulting pattern — a mosaic of coloured wells — visually represents the functional potential of your soil microbial community.
In short:
- The more coloured wells, the more active and diverse your microbes are.
- The pattern itself reveals which biological processes are most active — an insight into how your soil microbes function, not just how many of them exist.
This visual fingerprint makes microbial activity tangible and easy to understand.
Microbiome status: Performance and Biodiversity
Healthy soil is a living ecosystem. The first section of BIOTREX results – Microbiome Status – focuses on two fundamental aspects:
- Microbial Performance – how actively your soil microbes are functioning.
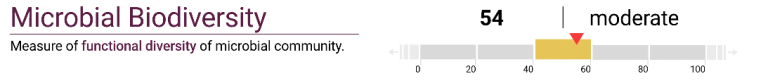
- Microbial Biodiversity – how diverse the community is.
Microbial Performance shows how actively the soil microbial community supports key processes such as nutrient cycling and mineralisation, reducing the need for external inputs like chemical fertilisers.
Microbial Biodiversity, on the other hand, indicates the ecological balance and long-term resilience of the soil. Higher biodiversity means greater stability, improved soil quality, and a lower risk of soil-borne diseases.
Together, these indicators reflect the overall vitality and stability of the soil microbiome.
functional insights: the core of soil functioning
The Functional Insights part of the BIOTREX Report translates metabolic activity into practical indicators related to key soil processes. These include:
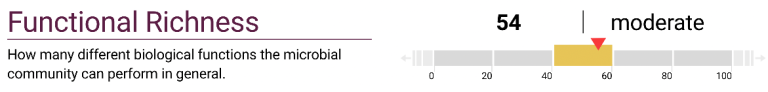
Functional Richness indicator reflects how many different substrates the microbes are able to utilise, describing their potential to provide various ecosystem services and metabolic functions.
It shows the agronomic potential of the soil and helps to optimise soil management to improve productivity. A richer functional profile supports crop nutrition and stabilises soil ecosystem.
Additional three indicators offer deeper insight into the key soil processes related to nutrient availability and recycling.
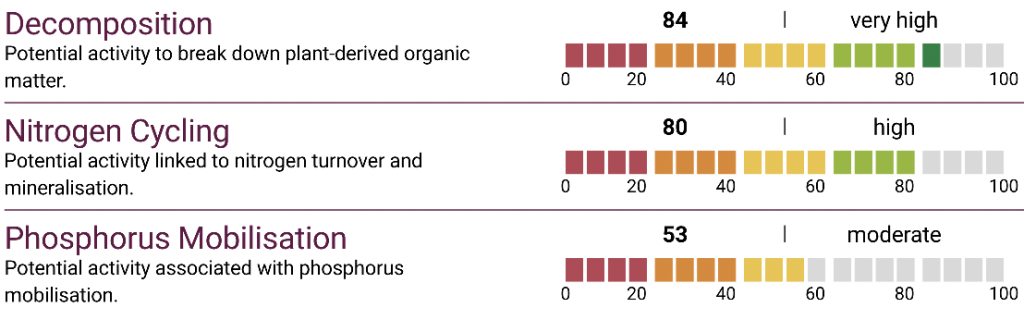
- Decomposition indicator describes the potential ability of microbes to break down organic matter and release nutrients.
- Nitrogen Cycling indicator measures the potential of microbes to contribute to nitrogen transformations that affect plant nutrition.
- Phosphorus Mobilisation indicator measures the potential ability of microbes to release phosphorus from organic and mineral sources, making it available to plants.
Each of BIOTREX indicators provides valuable insight into how your soil ecosystem works — and how it responds to management practices.
For example, after applying a microbial inoculant or adopting reduced tillage, you can use these functional indicators to monitor biological improvement and confirm that beneficial processes are becoming more active.
biotrex report: designed for clarity and action
Whether you’re an agronomist comparing regenerative practices, a researcher running field trials, or a product developer testing microbial formulations, the BIOTREX Report helps you see the invisible processes shaping your soil’s health.
- Simple format – results are organized clearly and visually.
- Scientific depth – data comes from advanced microbial community profiling.
- Action-oriented insights – indicators guide you toward decisions that improve soil function and resilience.
BIOTREX Report bridges the gap between laboratory precision and practical decision-making.
It’s soil biology made simple — and actionable.
Ready to explore how BIOTREX can support your goals?
Book a free call with our experts and discover the impact microbial data can have on your business.